

ISO/DTR 24962
(Main)Sampling-based conformity assessment
General Information
- Abstract
This TR provides an overview of the use of prior information in acceptance sampling. The methods described in the present TR can be applied for the inspection of both processes and lots. Not only do manufacturing or production processes lie within the scope of the present TR; but the scope also covers any process whose outcome are discrete physical or digital units whose conformity can be assessed. In particular, the method described in the present TR can also be applied to AI-based classification systems. The production unit would then consist of the pair (object to be assigned to a class, assigned class) and a conforming unit would be defined as a correct classification. As far as lots are concerned, the scope of the present TR includes both the inspection of isolated lots and serial lot inspection. The term “isolated lot inspection” does not mean that the consumer has no access to information regarding lot quality prior to the inspection of the current lot. Rather “isolated lot inspection” means that there are no switching rules and that the acceptance sampling plan is calculated separately for each new lot. In particular, the consumer having past experience with or knowledge regarding the producer of the lot currently under inspection is perfectly compatible with the concept of “isolated lot inspection.” This TR consists of three main parts. First, a risk-based approach is described (Section REF _Ref187325464 \r \h 7 08D0C9EA79F9BACE118C8200AA004BA90B02000000080000000E0000005F005200650066003100380037003300320035003400360034000000 ). This approach is based on concepts (such as specific consumer’s risk and conformance probability) defined in JCGM 106. It is shown how the sample size and the acceptance number can be calculated once a region for lot conformance and a tolerance for the specific consumer risk have been specified. In addition, an overview of information-based risks is provided. Second, a utility-based approach is described (Section REF _Ref193969454 \r \h 8 08D0C9EA79F9BACE118C8200AA004BA90B02000000080000000E0000005F005200650066003100390033003900360039003400350034000000 ). This approach replaces the underlying principle of risk aversion with a rational cost-benefit calculus. Indeed, risk-based approaches consider neither the testing & sampling costs, nor hidden costs such as administrative overhead, nor the potential benefits associated with lot acceptance. By contrast, in the utility-based approach, all potential benefits, costs, losses and damages—including testing & sampling costs, potential costs associated with recalling a lot or healthcare, reputational costs, costs caused by the ingestion of contaminated food, and the bureaucratic and administrative costs associated with the implementation of regulations—are internalized in one utility function. In this sense, the utility approach bridges the gap between the “old world” of risks and the “new world” of utility. Tables with standard plans for various cost-structures and lot size values are provided. Third, an approach for serial lot inspection is described (Section 9). In this approach, a Bayesian updating framework is provided in which data-ageing is reflected in a downweighting mechanism for older data. Prior to these three parts, there are five preliminary sections: · Introduction (Section REF _Ref193969493 \r \h 2 08D0C9EA79F9BACE118C8200AA004BA90B02000000080000000E0000005F005200650066003100390033003900360039003400390033000000 ) · Background information regarding the plans in the ISO 2859 and ISO 3951 standards (Section REF _Ref187317559 \r \h 3 08D0C9EA79F9BACE118C8200AA004BA90B02000000080000000E0000005F005200650066003100380037003300310037003500350039000000 ) · Background regarding prior and posterior distributions (Section REF _Ref193969590 \r \h 4 08D0C9EA79F9BACE118C8200AA004BA90B02000000080000000E0000005F005200650066003100390033003900360039003500390030000000 ) · Overall framework in which the classical and information-based risks c
- Status
- Not Published
- Technical Committee
- ISO/TC 69/SC 5 - Acceptance sampling
- Drafting Committee
- ISO/TC 69/SC 5/WG 10 - Audit sampling
- Current Stage
- 5020 - FDIS ballot initiated: 2 months. Proof sent to secretariat
- Start Date
- 11-Aug-2026
- Completion Date
- 11-Aug-2026
Buy Documents
ISO/DTR 24962 - Sampling-based conformity assessment
REDLINE ISO/DTR 24962 - Sampling-based conformity assessment
Overview
ISO/DTR 24962: Sampling-Based Conformity Assessment is a technical report by the International Organization for Standardization (ISO) that provides a comprehensive overview of utilizing prior information in acceptance sampling. This guidance applies not only to manufacturing and production environments but to any process yielding discrete, assessable physical or digital units, including modern AI-based systems. The technical report addresses both process and lot inspections, covering isolated lots and serial inspection, and supports data-driven, pragmatic approaches for designing efficient sampling plans.
This ISO technical report aims to offer clear methods for the integration of statistical risks, utility, and prior evidence in conformity assessment, pursuing improvements in quality assurance, cost efficiency, and decision-making across diverse industries.
Key Topics
- Conformity Assessment & Acceptance Sampling: Explains fundamental differences and similarities, particularly regarding the evaluation of processes, lots, or individual items for conformity to specified requirements.
- Incorporation of Prior Information: Details how empirical data, certificates, or expert-elicited knowledge can inform acceptance sampling, supporting reductions in sample sizes and resource use.
- Risk-Based Approach: Describes classical and information-based risks, such as consumer’s risk and producer’s risk, drawing on methods anchored in JCGM 106. Explains how calculated sample sizes and acceptance numbers relate to specified conformance regions and risk tolerances.
- Utility-Based Approach: Introduces rational cost-benefit analysis, considering testing, sampling, recall, healthcare, administrative, and reputational costs in the sampling plan. This broadens risk assessment to account for real-world financial considerations.
- Serial Lot Inspection & Bayesian Updating: Outlines frameworks for ongoing inspection operations, using Bayesian updating to reflect both fresh and aging data, enabling dynamic adaptation of sampling plans over time.
- Terminology & Definitions: Provides an extensive glossary aligning with ISO and JCGM 106, ensuring clarity and harmonization within the context of conformity assessment and acceptance sampling.
Applications
ISO/DTR 24962 offers practical value for many organizations and industries, including:
- Manufacturing & Production: Supports quality control in batch or continuous processes, guiding optimal inspection points to balance assurance levels and sample sizes.
- Digital & AI Systems: Applies to digital outputs such as classification results in AI systems, defining conformity as correct classification and enabling robust post-deployment monitoring.
- Trade & Regulatory Compliance: Aids food safety agencies, industrial quality inspectors, and import/export officers in evidence-based acceptance or rejection decisions, for both isolated and serial shipment lots.
- Process Improvement: Facilitates feedback-driven improvement initiatives by integrating historical quality data into ongoing inspection plans, encouraging data-driven risk management.
- Cost Management: Enables organizations to internalize all costs and potential benefits (including hidden or administrative costs) in conformity assessment planning, promoting sustainable and economical decision-making.
By supporting both traditional risk-based methods and innovative utility-based approaches, ISO/DTR 24962 equips users to adapt conformity assessment practices to new business models, regulatory requirements, and technological advancements.
Related Standards
- ISO 2859 Series: Sampling procedures for inspection by attributes, offering foundational sampling plans referenced within ISO/DTR 24962.
- ISO 3951 Series: Focuses on sampling by variables for quality control, complementary for continuous measurement processes.
- JCGM 106: Provides the statistical principles for information-based risks and Bayesian conformity assessment, forming the theoretical foundation for this technical report.
- ISO 17025: Relevant for laboratories on decision rules incorporating measurement uncertainty-a key distinction discussed in ISO/DTR 24962.
By referencing these and other standards, ISO/DTR 24962 supports harmonization and effective implementation of sampling-based conformity assessment across sectors.
Buy Documents
ISO/DTR 24962 - Sampling-based conformity assessment
REDLINE ISO/DTR 24962 - Sampling-based conformity assessment
Get Certified
Connect with accredited certification bodies for this standard

BSI Group
BSI (British Standards Institution) is the business standards company that helps organizations make excellence a habit.

Bureau Veritas
Bureau Veritas is a world leader in laboratory testing, inspection and certification services.

DNV
DNV is an independent assurance and risk management provider.
Sponsored listings
Frequently Asked Questions
ISO/DTR 24962 is a draft published by the International Organization for Standardization (ISO). Its full title is "Sampling-based conformity assessment". This standard covers: This TR provides an overview of the use of prior information in acceptance sampling. The methods described in the present TR can be applied for the inspection of both processes and lots. Not only do manufacturing or production processes lie within the scope of the present TR; but the scope also covers any process whose outcome are discrete physical or digital units whose conformity can be assessed. In particular, the method described in the present TR can also be applied to AI-based classification systems. The production unit would then consist of the pair (object to be assigned to a class, assigned class) and a conforming unit would be defined as a correct classification. As far as lots are concerned, the scope of the present TR includes both the inspection of isolated lots and serial lot inspection. The term “isolated lot inspection” does not mean that the consumer has no access to information regarding lot quality prior to the inspection of the current lot. Rather “isolated lot inspection” means that there are no switching rules and that the acceptance sampling plan is calculated separately for each new lot. In particular, the consumer having past experience with or knowledge regarding the producer of the lot currently under inspection is perfectly compatible with the concept of “isolated lot inspection.” This TR consists of three main parts. First, a risk-based approach is described (Section REF _Ref187325464 \r \h 7 08D0C9EA79F9BACE118C8200AA004BA90B02000000080000000E0000005F005200650066003100380037003300320035003400360034000000 ). This approach is based on concepts (such as specific consumer’s risk and conformance probability) defined in JCGM 106. It is shown how the sample size and the acceptance number can be calculated once a region for lot conformance and a tolerance for the specific consumer risk have been specified. In addition, an overview of information-based risks is provided. Second, a utility-based approach is described (Section REF _Ref193969454 \r \h 8 08D0C9EA79F9BACE118C8200AA004BA90B02000000080000000E0000005F005200650066003100390033003900360039003400350034000000 ). This approach replaces the underlying principle of risk aversion with a rational cost-benefit calculus. Indeed, risk-based approaches consider neither the testing & sampling costs, nor hidden costs such as administrative overhead, nor the potential benefits associated with lot acceptance. By contrast, in the utility-based approach, all potential benefits, costs, losses and damages—including testing & sampling costs, potential costs associated with recalling a lot or healthcare, reputational costs, costs caused by the ingestion of contaminated food, and the bureaucratic and administrative costs associated with the implementation of regulations—are internalized in one utility function. In this sense, the utility approach bridges the gap between the “old world” of risks and the “new world” of utility. Tables with standard plans for various cost-structures and lot size values are provided. Third, an approach for serial lot inspection is described (Section 9). In this approach, a Bayesian updating framework is provided in which data-ageing is reflected in a downweighting mechanism for older data. Prior to these three parts, there are five preliminary sections: · Introduction (Section REF _Ref193969493 \r \h 2 08D0C9EA79F9BACE118C8200AA004BA90B02000000080000000E0000005F005200650066003100390033003900360039003400390033000000 ) · Background information regarding the plans in the ISO 2859 and ISO 3951 standards (Section REF _Ref187317559 \r \h 3 08D0C9EA79F9BACE118C8200AA004BA90B02000000080000000E0000005F005200650066003100380037003300310037003500350039000000 ) · Background regarding prior and posterior distributions (Section REF _Ref193969590 \r \h 4 08D0C9EA79F9BACE118C8200AA004BA90B02000000080000000E0000005F005200650066003100390033003900360039003500390030000000 ) · Overall framework in which the classical and information-based risks c
This TR provides an overview of the use of prior information in acceptance sampling. The methods described in the present TR can be applied for the inspection of both processes and lots. Not only do manufacturing or production processes lie within the scope of the present TR; but the scope also covers any process whose outcome are discrete physical or digital units whose conformity can be assessed. In particular, the method described in the present TR can also be applied to AI-based classification systems. The production unit would then consist of the pair (object to be assigned to a class, assigned class) and a conforming unit would be defined as a correct classification. As far as lots are concerned, the scope of the present TR includes both the inspection of isolated lots and serial lot inspection. The term “isolated lot inspection” does not mean that the consumer has no access to information regarding lot quality prior to the inspection of the current lot. Rather “isolated lot inspection” means that there are no switching rules and that the acceptance sampling plan is calculated separately for each new lot. In particular, the consumer having past experience with or knowledge regarding the producer of the lot currently under inspection is perfectly compatible with the concept of “isolated lot inspection.” This TR consists of three main parts. First, a risk-based approach is described (Section REF _Ref187325464 \r \h 7 08D0C9EA79F9BACE118C8200AA004BA90B02000000080000000E0000005F005200650066003100380037003300320035003400360034000000 ). This approach is based on concepts (such as specific consumer’s risk and conformance probability) defined in JCGM 106. It is shown how the sample size and the acceptance number can be calculated once a region for lot conformance and a tolerance for the specific consumer risk have been specified. In addition, an overview of information-based risks is provided. Second, a utility-based approach is described (Section REF _Ref193969454 \r \h 8 08D0C9EA79F9BACE118C8200AA004BA90B02000000080000000E0000005F005200650066003100390033003900360039003400350034000000 ). This approach replaces the underlying principle of risk aversion with a rational cost-benefit calculus. Indeed, risk-based approaches consider neither the testing & sampling costs, nor hidden costs such as administrative overhead, nor the potential benefits associated with lot acceptance. By contrast, in the utility-based approach, all potential benefits, costs, losses and damages—including testing & sampling costs, potential costs associated with recalling a lot or healthcare, reputational costs, costs caused by the ingestion of contaminated food, and the bureaucratic and administrative costs associated with the implementation of regulations—are internalized in one utility function. In this sense, the utility approach bridges the gap between the “old world” of risks and the “new world” of utility. Tables with standard plans for various cost-structures and lot size values are provided. Third, an approach for serial lot inspection is described (Section 9). In this approach, a Bayesian updating framework is provided in which data-ageing is reflected in a downweighting mechanism for older data. Prior to these three parts, there are five preliminary sections: · Introduction (Section REF _Ref193969493 \r \h 2 08D0C9EA79F9BACE118C8200AA004BA90B02000000080000000E0000005F005200650066003100390033003900360039003400390033000000 ) · Background information regarding the plans in the ISO 2859 and ISO 3951 standards (Section REF _Ref187317559 \r \h 3 08D0C9EA79F9BACE118C8200AA004BA90B02000000080000000E0000005F005200650066003100380037003300310037003500350039000000 ) · Background regarding prior and posterior distributions (Section REF _Ref193969590 \r \h 4 08D0C9EA79F9BACE118C8200AA004BA90B02000000080000000E0000005F005200650066003100390033003900360039003500390030000000 ) · Overall framework in which the classical and information-based risks c
ISO/DTR 24962 is classified under the following ICS (International Classification for Standards) categories: 03.120.20 - Product and company certification. Conformity assessment; 03.120.30 - Application of statistical methods. The ICS classification helps identify the subject area and facilitates finding related standards.
ISO/DTR 24962 is available in PDF format for immediate download after purchase. The document can be added to your cart and obtained through the secure checkout process. Digital delivery ensures instant access to the complete standard document.
Standards Content (Sample)
FINAL DRAFT
Technical
Report
ISO/TC 69/SC 5
Sampling-based conformity
Secretariat: BSI
assessment
Voting begins on:
2026-08-11
Voting terminates on:
2026-10-06
RECIPIENTS OF THIS DRAFT ARE INVITED TO SUBMIT,
WITH THEIR COMMENTS, NOTIFICATION OF ANY
RELEVANT PATENT RIGHTS OF WHICH THEY ARE AWARE
AND TO PROVIDE SUPPOR TING DOCUMENTATION.
IN ADDITION TO THEIR EVALUATION AS
BEING ACCEPTABLE FOR INDUSTRIAL, TECHNO
LOGICAL, COMMERCIAL AND USER PURPOSES, DRAFT
INTERNATIONAL STANDARDS MAY ON OCCASION HAVE
TO BE CONSIDERED IN THE LIGHT OF THEIR POTENTIAL
TO BECOME STAN DARDS TO WHICH REFERENCE MAY BE
MADE IN NATIONAL REGULATIONS.
Reference number
FINAL DRAFT
Technical
Report
ISO/TC 69/SC 5
Sampling-based conformity
Secretariat: BSI
assessment
Voting begins on:
Voting terminates on:
RECIPIENTS OF THIS DRAFT ARE INVITED TO SUBMIT,
WITH THEIR COMMENTS, NOTIFICATION OF ANY
RELEVANT PATENT RIGHTS OF WHICH THEY ARE AWARE
AND TO PROVIDE SUPPOR TING DOCUMENTATION.
© ISO 2026
IN ADDITION TO THEIR EVALUATION AS
All rights reserved. Unless otherwise specified, or required in the context of its implementation, no part of this publication may
BEING ACCEPTABLE FOR INDUSTRIAL, TECHNO
LOGICAL, COMMERCIAL AND USER PURPOSES, DRAFT
be reproduced or utilized otherwise in any form or by any means, electronic or mechanical, including photocopying, or posting on
INTERNATIONAL STANDARDS MAY ON OCCASION HAVE
the internet or an intranet, without prior written permission. Permission can be requested from either ISO at the address below
TO BE CONSIDERED IN THE LIGHT OF THEIR POTENTIAL
or ISO’s member body in the country of the requester.
TO BECOME STAN DARDS TO WHICH REFERENCE MAY BE
MADE IN NATIONAL REGULATIONS.
ISO copyright office
CP 401 • Ch. de Blandonnet 8
CH-1214 Vernier, Geneva
Phone: +41 22 749 01 11
Email: copyright@iso.org
Website: www.iso.org
Published in Switzerland Reference number
ii
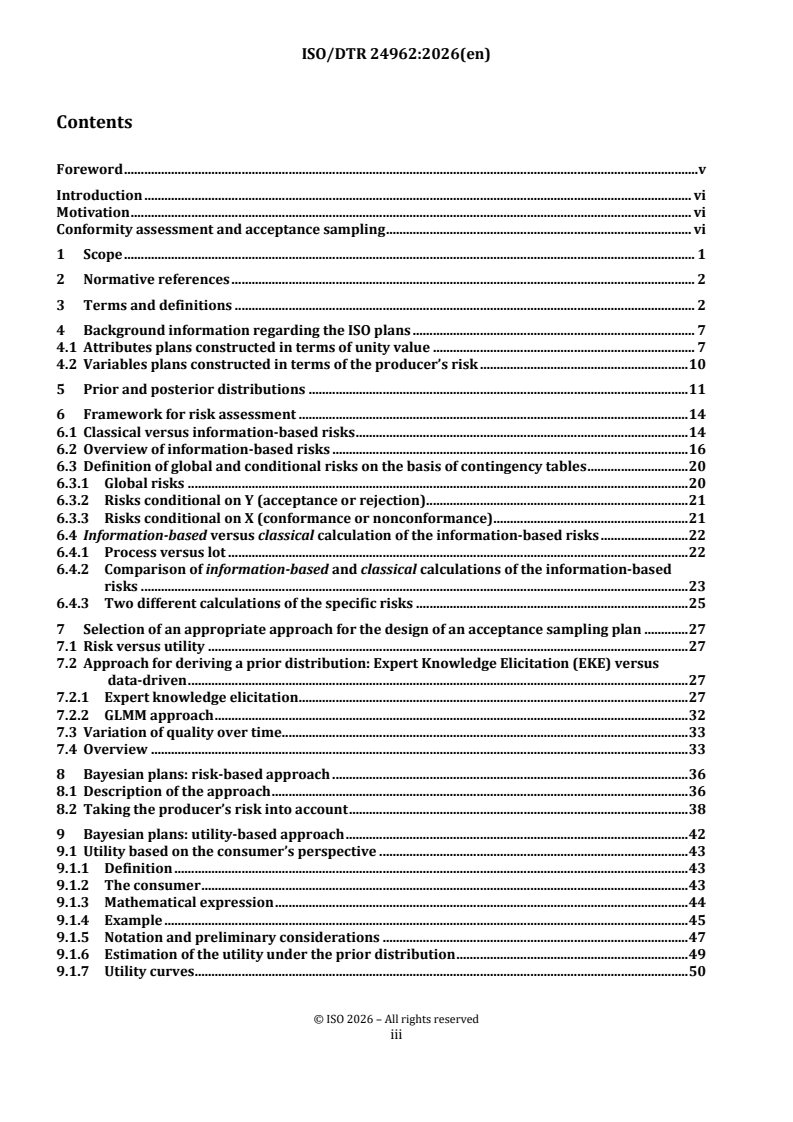
Contents
Foreword . v
Introduction . vi
Motivation . vi
Conformity assessment and acceptance sampling . vi
1 Scope . 1
2 Normative references . 2
3 Terms and definitions . 2
4 Background information regarding the ISO plans . 7
4.1 Attributes plans constructed in terms of unity value . 7
4.2 Variables plans constructed in terms of the producer’s risk . 10
5 Prior and posterior distributions . 11
6 Framework for risk assessment . 14
6.1 Classical versus information-based risks . 14
6.2 Overview of information-based risks . 16
6.3 Definition of global and conditional risks on the basis of contingency tables . 20
6.3.1 Global risks . 20
6.3.2 Risks conditional on 𝐘𝐘 (acceptance or rejection) . 21
6.3.3 Risks conditional on 𝐗𝐗 (conformance or nonconformance) . 21
6.4 Information-based versus classical calculation of the information-based risks . 22
6.4.1 Process versus lot . 22
6.4.2 Comparison of information-based and classical calculations of the information-based
risks . 23
6.4.3 Two different calculations of the specific risks . 25
7 Selection of an appropriate approach for the design of an acceptance sampling plan . 27
7.1 Risk versus utility . 27
7.2 Approach for deriving a prior distribution: Expert Knowledge Elicitation (EKE) versus
data-driven . 27
7.2.1 Expert knowledge elicitation . 27
7.2.2 GLMM approach . 32
7.3 Variation of quality over time. 33
7.4 Overview . 33
8 Bayesian plans: risk-based approach . 36
8.1 Description of the approach . 36
8.2 Taking the producer’s risk into account . 38
9 Bayesian plans: utility-based approach . 42
9.1 Utility based on the consumer’s perspective . 43
9.1.1 Definition . 43
9.1.2 The consumer . 43
9.1.3 Mathematical expression . 44
9.1.4 Example . 45
9.1.5 Notation and preliminary considerations . 47
9.1.6 Estimation of the utility under the prior distribution . 49
9.1.7 Utility curves . 50
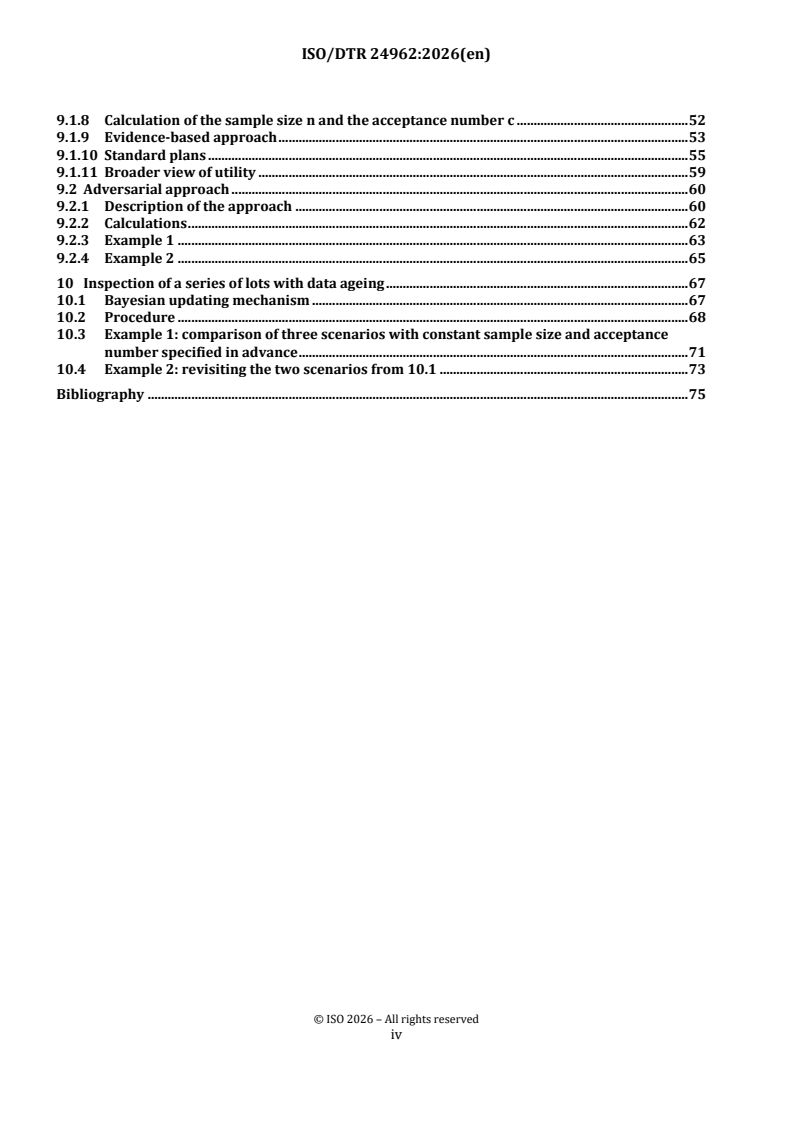
iii
9.1.8 Calculation of the sample size 𝐧𝐧 and the acceptance number 𝐜𝐜 . 52
9.1.9 Evidence-based approach . 53
9.1.10 Standard plans . 55
9.1.11 Broader view of utility . 59
9.2 Adversarial approach . 60
9.2.1 Description of the approach . 60
9.2.2 Calculations . 62
9.2.3 Example 1 . 63
9.2.4 Example 2 . 65
10 Inspection of a series of lots with data ageing . 67
10.1 Bayesian updating mechanism . 67
10.2 Procedure . 68
10.3 Example 1: comparison of three scenarios with constant sample size and acceptance
number specified in advance . 71
10.4 Example 2: revisiting the two scenarios from 10.1 . 73
Bibliography . 75
iv
Foreword
ISO (the International Organization for Standardization) is a worldwide federation of national standards
bodies (ISO member bodies). The work of preparing International Standards is normally carried out through
ISO technical committees. Each member body interested in a subject for which a technical committee has been
established has the right to be represented on that committee. International organizations, governmental and
non-governmental, in liaison with ISO, also take part in the work. ISO collaborates closely with the
International Electrotechnical Commission (IEC) on all matters of electrotechnical standardization.
The procedures used to develop this document and those intended for its further maintenance are described
in the ISO/IEC Directives, Part 1. In particular, the different approval criteria needed for the different types of
ISO documents should be noted. This document was drafted in accordance with the editorial rules of the
ISO/IEC Directives, Part 2 (see www.iso.org/directives).
ISO draws attention to the possibility that the implementation of this document may involve the use of (a)
patent(s). ISO takes no position concerning the evidence, validity or applicability of any claimed patent rights
in respect thereof. As of the date of publication of this document, ISO had not received notice of (a) patent(s)
which may be required to implement this document. However, implementers are cautioned that this may not
represent the latest information, which may be obtained from the patent database available at
www.iso.org/patents. ISO shall not be held responsible for identifying any or all such patent rights.
Any trade name used in this document is information given for the convenience of users and does not
constitute an endorsement.
For an explanation of the voluntary nature of standards, the meaning of ISO specific terms and expressions
related to conformity assessment, as well as information about ISO's adherence to the World Trade
Organization (WTO) principles in the Technical Barriers to Trade (TBT), see www.iso.org/iso/foreword.html.
This document was prepared by Technical Committee ISO/TC 69, Applications of statistical methods,
Subcommittee SC 5, Acceptance sampling.
Any feedback or questions on this document should be directed to the user’s national standards body. A
complete listing of these bodies can be found at www.iso.org/members.html.
v
Introduction
0.1 Motivation
The question whether the contents of a given lot (shipment, container, batch) or the production units of a
process meet specified quality criteria plays a central role in many areas. For instance, in industry, lot or
process inspection is a quality control measure for monitoring a manufacturing process; in international trade,
lot inspection is performed to decide whether to accept an individual lot; and a governmental food safety
agency inspects lots to ensure contaminant levels are below legal limits. Inspecting the entire lot is seldom a
viable option. Instead, a random sample is taken from the lot and an acceptance rule is applied to the test
results (whether qualitative or quantitative) obtained from the sample. The activity of inspecting lots in this
manner is referred to as acceptance sampling. An acceptance sampling plan thus consists of instructions for
taking a sample (in particular, a requirement regarding sample size) and an acceptance rule.
Acceptance sampling plans are described in the ISO 2859 series (inspection by attributes) and the ISO 3951
series (inspection by variables). The plans in these ISO standards are indexed by lot size and a given lot quality
level expressed e.g. in terms of the proportion of nonconforming items in the lot. This characterization of lot
quality is intended to represent either a quality level at which a high probability of acceptance is desirable, in
which case it is called the acceptance quality limit (AQL) or the producer’s risk quality level (PRQ); or a quality
level at which a low probability of acceptance is desirable, in which case it is called the limiting quality (LQ)
or the consumer’s risk quality level (CRQ). The plans in these ISO standards are assessed via the operating
characteristic curve (OC curve), which plots the probability of acceptance against the quality level and via the
producer’s risk PR (the probability of rejection at PRQ) and the consumer’s risk CR (the probability of
acceptance at CRQ).
The main question this document addresses is the following: is it possible to propose a framework for the
design of acceptance sampling plans which mobilizes prior information in order to achieve a reduction in
sample size?
JCGM 106 [1] discusses how to take measurement uncertainty into consideration in conformity assessment,
i.e. in determining whether an individual test item fulfils specified requirements. In doing so, JCGM 106
proposes a Bayesian framework along with new definitions of the producer’s and consumer’s risks which will,
in the following, be collectively referred to as “information-based” risks. Many of the concepts from JCGM 106
will be adapted and applied in this document.
Even though the focus in this document is on the inspection of isolated lots, there is often an underlying
production process. This raises the question of the extent to which it is sensible to incorporate information
regarding the quality of the process or the quality of previous lots in the design of the acceptance sampling
plan for the lot currently under inspection. This aspect will play a central role in this document. Clause 10
addresses the inspection of a series of lots.
Finally, it must be emphasized that, in connection with the lot inspection applications considered in the
present technical report, it is not admissible to establish prior distributions on the basis of purely subjective
belief. Here prior distributions have to be based on evidence obtained via sound scientific methods. The form
such evidence takes can be e.g. empirical data from past inspections, quality control data or certificates from
the producer/manufacturer or a report or conclusions obtained via a formal expert knowledge elicitation
procedure (see 7.2.1). For a more extensive discussion of these and related questions, the reader is referred
to Bernardo (2005) [17] and Göb (2015) [19].
0.2 Conformity assessment and acceptance sampling
In sampling-based conformity assessment, there are three levels of conformity: the conformity of the process,
of the lot and of individual items. The central question is whether the lot or process is conforming, and the
main difference between the approach described here and the ISO approach is that a conformity region for lot
vi
or process quality must be defined prior to acceptance sampling. If the focus is lot inspection, the conformity
of the process is not directly taken into account; rather, it plays a role in the background insofar as it underlies
the quality of the lot. Finally, the quality of individual items plays a role insofar as the quality of the lot or
process is expressed in terms of the proportion of nonconforming items and insofar as the criterion for process
or lot acceptance is expressed in terms of the number of nonconforming items in the sample. The criterion for
the conformity of an individual item can be expressed e.g. in terms of specification limits .
Comparing JCGM 106 with the ISO standards on acceptance sampling, it would seem reasonable to draw the
following distinction between conformity assessment (CA) and acceptance sampling (AS):
— in CA as per JCGM 106, testing is performed based on one single item; the aim is to assess the
conformity of the true value of the property of interest (i.e. the measurand, in the strict metrological
sense). There is no attempt to evaluate the quality of a lot from a sample of items drawn from that lot.
— in AS as per ISO standards, testing is performed based on a sample of several discrete items taken from
the lot. In inspection by variables, it is not the conformity of each item which is determined; rather,
one test result is obtained for each item in the sample, and the proportion nonconforming in the lot is
estimated on the basis of the distribution of these test results.
A related difference between the two is as follows:
— In CA, measurement uncertainty is taken into account in the decision rule . Thus, in CA, the focus is on
the measurand.
— In AS for inspection by variables as per ISO standards, the rule for lot acceptance or rejection takes
into account the lot standard deviation, which describes how the property of interest varies in the lot,
rather than variation between test results, which could reflect other effects such as analytical
uncertainty, effects due to the sampling procedure (sampling uncertainty), etc. Thus, in AS, the
acceptance rule is expressed in terms of the statistical properties of the lot and, if possible,
measurement uncertainty is ignored.
The following points highlight conceptual similarities between conformity assessment and acceptance
sampling:
— AS can be “re-interpreted” in such a way that the entire framework is formulated in terms of a
“measurand,” thus establishing a common conceptual framework with conformity assessment. In this
re-interpretation, the measurand consists of the relevant parameters (e.g. proportion nonconforming,
lot mean, lot standard deviation) for the lot.
— In the classical CA framework, conformity often requires the measurement uncertainty to be
sufficiently low, e.g. in the case of a decision rule such as test result + uncertainty ≤ upper specification
limit. Similarly, in AS, one could formulate requirements regarding sufficiently low specific producer’s
or consumer’s risks.
— For both CA and AS, one can define “information-based” risks which can be regarded as
complementary to the “classical” risks as defined in the ISO standards (see 6.1).
In ISO standards, the term specification limit is reserved for criteria regarding individual items.
The definition of a “decision rule” (for use in conformity assessment) in ISO 17025 [3] is as follows: Rule that describes
how measurement uncertainty is accounted for when stating conformity with a specified requirement.
vii
Finally, if acceptance sampling takes the form of applying a criterion for the lot mean and if only one test result
is obtained from a unique composite sample obtained from the lot, then there might not be any meaningful
distinction between conformity assessment and acceptance sampling. Hence, in clarifying the relationship
between conformity assessment and acceptance sampling, the distinction between plans for the proportion
nonconforming and plans for the lot mean needs to be borne in mind. This can simply be equivalent to
distinguishing plans where the criterion is formulated in terms of a measurand in the strict metrological sense
and plans where the criterion relates to the proportion nonconforming.
viii
FINAL DRAFT Technical Report ISO/DTR 24962:2026(en)
Sampling-based conformity assessment
1 Scope
This document provides an overview of the use of prior information in acceptance sampling. The methods
described in this document can be applied for the inspection of both processes and lots.
Not only do manufacturing or production processes lie within the scope of this document; but the scope also
covers any process whose outcome are discrete physical or digital units whose conformity can be assessed. In
particular, the method described in this document can also be applied to AI-based classification systems. The
production unit would then consist of the pair (object to be assigned to a class, assigned class) and a
conforming unit would be defined as a correct classification.
As far as lots are concerned, the scope of this document includes both the inspection of isolated lots and serial
lot inspection. The term “isolated lot inspection” does not mean that the consumer has no access to
information regarding lot quality prior to the inspection of the current lot. Rather “isolated lot inspection”
means that there are no switching rules and that the acceptance sampling plan is calculated separately for
each new lot. In particular, the consumer having past experience with or knowledge regarding the producer of
the lot currently under inspection is perfectly compatible with the concept of “isolated lot inspection.”
This document consists of three main parts.
First, a risk-based approach is described (see Clause 8). This approach is based on concepts (such as specific
consumer’s risk and conformance probability) defined in JCGM 106. It is shown how the sample size and the
acceptance number can be calculated once a region for lot conformance and a tolerance for the specific
consumer risk have been specified. In addition, an overview of information-based risks is provided.
Second, a utility-based approach is described (see Clause 9). This approach replaces the underlying principle
of risk aversion with a rational cost-benefit calculus. Indeed, risk-based approaches consider neither the
testing and sampling costs, nor hidden costs such as administrative overhead, nor the potential benefits
associated with lot acceptance. By contrast, in the utility-based approach, all potential benefits, costs, losses
and damages—including testing and sampling costs, potential costs associated with recalling a lot or
healthcare, reputational costs, costs caused by the ingestion of contaminated food, and the bureaucratic and
administrative costs associated with the implementation of regulations—are internalized in one utility
function. In this sense, the utility approach bridges the gap between the “old world” of risks and the “new
world” of utility. Tables with standard plans for various cost-structures and lot size values are provided.
Third, an approach for serial lot inspection is described (see Clause 9). In this approach, a Bayesian updating
framework is provided in which data-ageing is reflected in a down weighting mechanism for older data.
Prior to these three parts, there are five preliminary clauses:
— Introduction;
— Terms and definitions (Clause 3);
— Background information regarding the plans in the ISO 2859 and ISO 3951 standards (Clause 4);
— Background regarding prior and posterior distributions (Clause 5);
— Overall framework in which the classical and information-based risks can be seen as complementary
(Clause 6);
— Guidance for deriving a prior distribution and selecting an appropriate approach for the design of an
acceptance sampling plan (Clause 7).
Throughout this document, the aim is to propose relatively straightforward and pragmatic methods for the
design of acceptance sampling plans. Nonetheless, in parallel to the approach, the background theory is
provided and illustrated with examples.
This document focuses on lots consisting of discrete items and lot inspection by attributes. The methods
presented here can be extended for lots consisting of bulk material and for inspection by variables. This will
be the subject of subsequent work.
Measurement and inspection error are not considered in this document. The methods described here can be
adjusted to take various error sources into account. This will be the subject of subsequent work.
Finally, in this document, the testing outcome is usually considered to follow a binomial distribution. Strictly
speaking, this is more appropriate for the underlying process than for the lot. The methods described in this
document can be adjusted in such a way that the testing outcome is modelled via the hypergeometric
distribution, see 6.4.2.
2 Normative references
There are no normative references in this document.
3 Terms and definitions
For the purposes of this document, the following terms and definitions apply.
ISO and IEC maintain terminology databases for use in standardization at the following addresses:
— ISO Online browsing platform: available at https://www.iso.org/obp
— IEC Electropedia: available at https://www.electropedia.org/
In the following, many terms are defined in relation to the lot. Where appropriate, the term lot can simply be
replaced by the term process. Much of the terminology and notation used in this technical report (TR) is taken
from or closely reflects JCGM 106 [1]. In JCGM 106 the realizations of random variables are denoted via Greek
letters (e.g. eta 𝜂𝜂). In such cases, for the sake of simplicity, the notation has been changed.
3.1
acceptance number
𝑐𝑐
specified maximum value for 𝑦𝑦 (number of items determined to be nonconforming during inspection) used in
the acceptance region [0, 𝑐𝑐]
3.2
acceptance region
𝒜𝒜
acceptance region expressed as the closed interval [0, 𝑐𝑐] where 𝑐𝑐 lies in [0, 𝑛𝑛] and denotes the acceptance
number (3.1) a specified maximum value for 𝑦𝑦 (the number of items determined to be nonconforming during
inspection)
Note 1 to entry: For instance, if 𝑐𝑐 is specified as 0 and 𝑦𝑦 > 0 is obtained during the lot inspection, the lot will be
rejected—no matter whether or not it actually complies with the criterion regarding lot quality.
Note 2 to entry: A closed interval [a,b] includes both a and b.
3.3
acceptance sampling plan
(𝑛𝑛, 𝑐𝑐)
acceptance sampling plan consisting of a sample size and acceptance number (3.1)
3.4
beta function
𝐵𝐵(𝛼𝛼,𝛽𝛽)
𝛼𝛼−1 𝛽𝛽−1
( ) ( )
𝐵𝐵𝛼𝛼,𝛽𝛽 =�𝑢𝑢 ∙ 1−𝑢𝑢 d𝑢𝑢
3.5
conditional consumer’s risk (conditional on 𝑿𝑿)
CCRₓ
probability that a lot is accepted given that it is nonconforming
3.6
conditional consumer’s risk (conditional on 𝒀𝒀)
CCR
y
probability that a lot is nonconforming given that it is accepted
3.7
conditional producer’s risk (conditional on 𝑿𝑿)
CPRₓ
probability that a lot is rejected given that it is conforming
3.8
conditional producer’s risk (conditional on 𝒀𝒀)
CPR
y
probability that a lot is conforming given that it is rejected
3.9
conformance probability
𝑝𝑝 (𝑦𝑦)
𝑐𝑐𝑐𝑐𝑛𝑛𝑐𝑐
probability of conformance given the testing outcome 𝑦𝑦
Note 1 to entry: The probability of conformance is evaluated for a given testing outcome y. For this reason, in a Bayesian
context, it is evaluated via the posterior distribution.
Note 2 to entry: This quantity plays a central role in the approach described in Clause 8.
3.10
consumer
trading party which purchases the lot from the producer
3.11
consumer’s risk
CR
probability that a nonconforming lot or that a lot with unacceptable quality CRQ (3.12) is accepted
3.12
consumer’s risk quality level
CRQ
lot quality level which is considered unacceptable and thus results in a low probability of acceptance (e.g.
10%)
Note 1 to entry: the CRQ is also called LQ (e.g. in the ISO 2850 and ISO 3951).
3.13
global consumer’s risk
GCR
probability that a lot is nonconforming and accepted
3.14
global probability of acceptance
GP
acc
probability that a lot is accepted whether it is conforming or not
3.15
global probability of rejection
GPᵣₑⱼ
probability that a lot is rejected whether it is conforming or not
3.16
global producer’s risk
GPR
probability that a lot is conforming and rejected
3.17
inspection by attributes
lot inspection where the test result for a given item is qualitative: conforming versus nonconforming
3.18
inspection by variables
lot inspection where the test result for a given item or laboratory sample is quantitative (continuous scale)
3.19
lot or process conformity region
𝒞𝒞
𝒞𝒞 denotes the conformance region for the “true” proportion nonconforming 𝑋𝑋, expressed as the closed interval
[0, 𝑥𝑥 ], where 𝑥𝑥 lies in [0,1] and denotes a specified maximum value for 𝑋𝑋
𝒞𝒞 𝒞𝒞
Note 1 to enry: For instance, if 𝑥𝑥 is specified as 10 %, this means that a lot whose true proportion
𝒞𝒞
nonconforming is greater than 10 % does not comply with the criterion regarding lot quality—no matter
whether it has been accepted or rejected.
3.20
lot proportion nonconforming
𝑥𝑥
𝐿𝐿
proportion of nonconforming items in the lot
Note 1 to entry: If the proportion nonconforming is modelled as a random variable, then 𝑥𝑥 and 𝑥𝑥 are realizations of 𝑋𝑋
𝑃𝑃 𝐿𝐿 𝑃𝑃
and 𝑋𝑋 , respectively.
𝐿𝐿
3.21
lot size
𝑁𝑁
number of items in the lot
3.22
number of nonconforming items in the lot
𝑀𝑀
Note 1 to entry: 𝑀𝑀𝑀𝑀𝑀𝑀𝑛𝑛 denotes the minimum number of nonconforming items in a lot of 𝑁𝑁 items (often, we have 𝑀𝑀𝑀𝑀𝑀𝑀𝑛𝑛 =
0, however, there are circumstances where 𝑀𝑀 = 0 is not possible).
Note 2 to entry: 𝑀𝑀𝒞𝒞 denotes the number of nonconforming items in a lot of 𝑁𝑁 items corresponding to upper limit of the
lot conformity region 𝑥𝑥𝒞𝒞, i.e. 𝑀𝑀𝒞𝒞 = floor(𝑥𝑥𝒞𝒞 ∙ 𝑁𝑁).
Note 3 to entry: 𝑀𝑀𝑀𝑀𝑀𝑀𝑥𝑥 denotes the maximum number of nonconforming items in a lot of 𝑁𝑁 items (often, we have 𝑀𝑀𝑀𝑀𝑀𝑀𝑥𝑥
= 𝑁𝑁, however, there are circumstances where 𝑀𝑀 = 𝑁𝑁 is not possible).
Note 4 to entry: 𝑀𝑀𝒞𝒞,𝑦𝑦 = 𝑥𝑥𝒞𝒞 ∙ 𝑁𝑁 − 𝑦𝑦 denotes the maximum number of nonconforming items in a conforming lot, taking into
account the 𝑦𝑦 nonconforming items in the sample.
3.23
lot proportion nonconforming posterior distribution
( | ) ( | )
𝑔𝑔𝑥𝑥𝑦𝑦 ; 𝑔𝑔 𝑥𝑥𝑦𝑦
𝑝𝑝𝑝𝑝𝑝𝑝𝑝𝑝
posterior distribution for the lot proportion nonconforming (3.20)
( | ) ( | )
Note 1 to entry: The consumer and producer can have different posteriors, denoted 𝑔𝑔 𝑥𝑥𝑦𝑦 and 𝑔𝑔 𝑥𝑥𝑦𝑦 ,
𝑐𝑐𝑝𝑝𝑐𝑐𝑝𝑝 𝑝𝑝𝑝𝑝𝑝𝑝𝑝𝑝
respectively.
3.24
lot proportion nonconforming prior distribution
𝑔𝑔 (𝑥𝑥); 𝑔𝑔 (𝑥𝑥;ϑ)
0 𝑝𝑝𝑝𝑝𝑝𝑝𝑝𝑝𝑝𝑝
prior distribution for the lot proportion nonconforming (3.20).
Note 1 to entry: The consumer and producer can have different priors, denoted 𝑔𝑔 (𝑥𝑥|𝑦𝑦) and 𝑔𝑔 (𝑥𝑥|𝑦𝑦), respectively.
𝑐𝑐𝑝𝑝𝑐𝑐𝑝𝑝 𝑝𝑝𝑝𝑝𝑝𝑝𝑝𝑝
3.25
probability density function of the beta distribution
𝑐𝑐 (𝑥𝑥;𝛼𝛼,𝛽𝛽)
𝐵𝐵𝐵𝐵𝑝𝑝𝐵𝐵
𝛼𝛼−1 𝛽𝛽−1
( )
𝑥𝑥 ∙ 1−𝑥𝑥
𝑐𝑐 (𝑥𝑥;𝛼𝛼,𝛽𝛽) =
𝐵𝐵𝐵𝐵𝑝𝑝𝐵𝐵
( )
𝐵𝐵𝛼𝛼,𝛽𝛽
3.26
probability mass function of binomial distribution
𝑐𝑐 (𝑦𝑦;𝑛𝑛,𝑥𝑥)
𝐵𝐵𝑝𝑝𝑐𝑐𝑝𝑝𝐵𝐵
𝑛𝑛
𝑦𝑦 𝑐𝑐−𝑦𝑦
𝑐𝑐 (𝑦𝑦;𝑛𝑛,𝑥𝑥) =� �∙𝑥𝑥 ∙ (1−𝑥𝑥)
𝐵𝐵𝑝𝑝𝑐𝑐𝑝𝑝𝐵𝐵
𝑦𝑦
3.27
probability mass function of hypergeometric distribution
𝑐𝑐 (𝑦𝑦;𝑛𝑛,𝑀𝑀,𝑁𝑁)
𝐻𝐻𝑦𝑦𝑝𝑝𝐵𝐵𝑝𝑝
𝑀𝑀 𝑁𝑁−𝑀𝑀
� �∙� �
𝑦𝑦 𝑐𝑐−𝑦𝑦
( )
𝑐𝑐 𝑦𝑦;𝑛𝑛,𝑀𝑀,𝑁𝑁 =
𝐻𝐻𝑦𝑦𝑝𝑝𝐵𝐵𝑝𝑝
𝑁𝑁
� �
𝑐𝑐
3.28
process proportion nonconforming
𝑥𝑥
𝑃𝑃
proportion of nonconforming items for the process
Note 1 to entry: If the proportion nonconforming is modelled as a random variable, then 𝑥𝑥 and 𝑥𝑥 are realizations of 𝑋𝑋
𝑃𝑃 𝐿𝐿 𝑃𝑃
and 𝑋𝑋 , respectively
𝐿𝐿
3.29
producer
trading party which sells the lot to the consumer
Note 1 to entry: the producer can be a manufacturer, supplier, state, etc.
3.30
producer’s risk
PR
probability that a conforming lot or that a lot with acceptable quality PRQ (3.31) is rejected
3.31
producer’s risk quality level
PRQ
lot quality level which is considered acceptable and thus results in a high probability of acceptance (e.g. 95%)
Note 1 to entry: the PRQ is also called AQL (e.g. in the ISO 2859 and ISO 3951 standards).
3.32
proportion nonconforming
𝑋𝑋
proportion of nonconforming items in the lot (or process)
Note 1 to entry: In Bayesian approaches to acceptance sampling, 𝑋𝑋 is a random variable with realizations 𝑥𝑥.
Note 2 to entry: In the ISO 2859 and ISO 3951 standards, the proportion nonconforming is treated as the parameter of a
statistical distribution for the probability of acceptance, i.e. as a constant.
3.33
sample size
𝑛𝑛
number of items in the sample taken from the lot
3.34
specific CR
SCR(𝑦𝑦)
probability that a lot is nonconforming given that it is accepted
Note 1 to entry: Evaluated for a specific testing outcome 𝑦𝑦 resulting in acceptance.
Note 2 to entry: This risk plays a central role in the approach described in Clause 8.
3.35
specific PR
SPR(𝑦𝑦)
probability that a lot is conforming given that it is rejected
Note 1 to entry: Evaluated for a specific testing outcome 𝑦𝑦 resulting in rejection.
3.36
testing outcome
𝑌𝑌
number of nonconforming items in the sample (determined after testing each item in the sample)
Note 1 to entry: 𝑌𝑌 is a random variable with realizations 𝑦𝑦
Note 2 to entry: Note that 𝑦𝑦/𝑛𝑛 can be considered a more appropriate testing outcome so that the “measurand” and the
“measurement” represent the same type of quantity (e.g. a proportion). Mathematically, however, the use of 𝑦𝑦 is more
convenient (via the binomial distribution).
3.37
process or lot conformity region upper limit
𝑥𝑥
𝒞𝒞
upper limit of the process or lot conformity region (3.19)
4 Background information regarding the ISO plans
The ISO standards apply a risk-based approach to the design of acceptance sampling plans, combined with a
focus on convenient or simplified calculations. In inspection by attributes, it is the product PRQ × sample size
(or, equivalently, the ratio between CRQ and PRQ) which informs the design of the plans. In inspection by
variables, the plans indexed by AQL (PRQ) aim to achieve a PR which depends on the lot size.
4.1 Attributes plans constructed in terms of unity value
In ISO 2859-1[8], the plans are constructed in such a manner as to have constant acceptance number values
across the diagonals of the sampling plan tables. This subclause provides a short rationale for this approach.
ISO 2859-1, the AQL (PRQ) values and the sample size values are “approximate” geometric series. The
following table shows a selection of sample size values along with the ratio between consecutive values.
Table 1 — Sample size values from ISO 2859-1 as a geometric series
Sample Ratio between consecutive
size sample sizes
8 1.60
13 1.63
20 1.54
32 1.60
50 1.56
As can be seen, the ratio between two consecutive sample size values is always close to 1.6. The ratio between
consecutive AQL (PRQ) values is also approximately 1.6, as shown in the following table.
Table 2 — AQL (PRQ) values from ISO 2859-1 as a geometric series
Ratio between consecutive
AQL
AQL values
0.010
0.015 1.50
0.025 1.67
0.040 1.60
0.065 1.63
0.100 1.54
As a result, the product PRQ × sample size remains “near constant” across the diagonals of the sampling plan
tables. This is illustrated in the following table, for a selection of AQL values.
Table 3 — The product PRQ × sample size remains “near constant” across the diagonals of the sampling plan tables
AQL (PRQ)
Sample
0.001 0.0015 0.0025 0.004 0.0065 0.01 0.015 0.025 0.04 0.065 0.1
size
2 0.002 0.003 0.005 0.008 0.013 0.02 0.03 0.05 0.08 0.13 0.2
3 0.003 0.005 0.008 0.012 0.020 0.03 0.05 0.08 0.12 0.20 0.3
5 0.005 0.008 0.013 0.020 0.033 0.05 0.08 0.13 0.20 0.33 0.5
8 0.008 0.012 0.020 0.032 0.052 0.08 0.12 0.20 0.32 0.52 0.8
13 0.013 0.020 0.033 0.052 0.085 0.13 0.20 0.33 0.52 0.85 1.3
20 0.020 0.030 0.050 0.080 0.130 0.20 0.30 0.50 0.80 1.30 2.0
32 0.032 0.048 0.080 0.128 0.208 0.32 0.48 0.80 1.28 2.08 3.2
50 0.050 0.075 0.125 0.200 0.325 0.50 0.75 1.25 2.00 3.25 5.0
80 0.080 0.120 0.200 0.320 0.520 0.80 1.20 2.00 3.20 5.20 8.0
125 0.125 0.188 0.313 0.500 0.813 1.25 1.88 3.13 5.00 8.13 12.5
200 0.200 0.300 0.500 0.800 1.300 2.00 3.00 5.00 8.00 13.00 20.0
315 0.315 0.473 0.788 1.260 2.048 3.15 4.73 7.88 12.60 20.48 31.5
500 0.500 0.750 1.250 2.000 3.250 5.00 7.50 12.50 20.00 32.50 50.0
800 0.800 1.200 2.000 3.200 5.200 8.00 12.00 20.00 32.00 52.00 80.0
1250 1.250 1.875 3.125 5.000 8.125 12.50 18.75 31.25 50.00 81.25 125.0
2000 2.000 3.000 5.000 8.000 13.000 20.00 30.00 50.00 80.00 130.00 200.0
The product PRQ × sample size is called the unity value and can be understood as the number of expected
nonconforming items in the sample for lot quality AQL. For example, for lot quality 1% proportion
nonconforming and a sample size of 20 items, we can expect 0.2 nonconforming items. This is the rationale
for having constant acceptance number values across diagonals in ISO 2859-1.
4.2 Variables plans constructed in terms of the producer’s risk
The “philosophy” of ISO acceptance sampling plans for inspection by variables is as follows:
First, the ISO plans are designed in such a manner as to ensure either a high probability of acceptance at the
acceptance quality limit (AQL) i.e. at the producer’s risk quality level (PRQ) or a low probability of acceptance
at the limiting quality (LQ) i.e. at the consumer’s risk quality level (CRQ).
Secondly, the ISO plans indexed by AQL are constructed in such a way that the producer’s risk decreases as
the lot size increases. The following table, taken from the Mathematical and Statistical Principles underlying
Military Standard 414 [2], shows the producer’s risk in terms of the sample size code letter (reflecting lot size):
Table 4 — Lot size in the ISO standards
Sample size code Producer’s risk
letter
B 0,11
C 0,10
D 0,10
E 0,10
F 0,10
G 0,09
H 0,08
I 0,07
J 0,06
K 0,06
L 0,05
M 0,05
N 0,04
O 0,03
P 0,02
Q 0,01
As can be seen the “target” PR of 5 % is only achieved from code letter L onwards. Indeed, the PR is better than
5 % from code letter N onwards, achieving 1 % for code letter Q.
In the plans in ISO 3951-2, the producer’s risk remains “near constant” along the diagonals (from bottom left
to top right).
Not all variables plans in the ISO 3951 series follow this principle. In particular, the plans in ISO 3951-1 and
ISO 3951-6 were constructed via “OC-curve-matching.” In ISO 3951-1, the plans (which are indexed by AQL,
i.e. PRQ) were constructed so as to obtain similar (near-identical in the case that the process standard
deviation is unknown) OC curves to those in ISO 2859-1, see 10.2 c) of ISO 3951-1. In ISO 3951-6, the plans
(which are indexed by LQ i.e. CRQ) were constructed so as to obtain similar OC curves to those in ISO 2859
-
2.
5 Prior and posterior distributions
The consumer’s or producer’s prior information regarding the “true” proportion nonconforming 𝑋𝑋 is
( ) ( )
encapsulated in the prior distribution 𝑔𝑔 𝑥𝑥 or 𝑔𝑔 𝑥𝑥 . For the sake of simplicity, this document focus
0,𝑐𝑐𝑝𝑝𝑐𝑐𝑝𝑝 0,𝑝𝑝𝑝𝑝𝑝𝑝𝑝𝑝
on the beta family of distributions for the prior and posterior. The rationale is threefold: first, calculations are
simplified and consistent ; second, the beta distribution is widely used in the literature (for example, the beta
distribution is a paradigm for expert knowledge elicitation methodologies); and third, it is highly flexible.
There are, of course, many other possibilities, both discrete (e.g. one- or two-point priors) and continuous.
However, a discussion of all available options for the prior distribution would exceed the scope of this
document.
The beta family of distributions is generated via two hyperparameters α and 𝛽𝛽. For a given choice of 𝛼𝛼 and 𝛽𝛽,
the corresponding beta distribution is denoted Beta(𝛼𝛼,𝛽𝛽) and the probability density function is denoted
𝑐𝑐 (𝑥𝑥;𝛼𝛼,𝛽𝛽), for 𝑥𝑥 in the interval [0,1]. The following diagram shows different beta distributions. As can be
𝐵𝐵𝐵𝐵𝑝𝑝𝐵𝐵
seen, this family of distributions is quite versatile, allowing very different curves to be mapped via the choice
of α and 𝛽𝛽.
The beta distribution is conjugate with respect to the binomial likelihood. This means that the posterior follows the
same distribution as the prior, so in serial inspection, there is consistent mathematics from one inspection to the next.
Key
X = Proportion nonconforming 𝒙𝒙 alpha = 1, beta = 5
Y = Probability density function 𝒇𝒇 (𝒙𝒙;𝜶𝜶,𝜷𝜷) alpha = 5, beta = 1
𝑩𝑩𝑩𝑩𝑩𝑩𝑩𝑩
alpha = 2, beta = 5
Figure 1 — Different beta distributions
The case that the consumer has no prior information can be represented by the choice α =𝛽𝛽 = 0.5. In the case
of the beta family of
...
ISO/TC 69/SC 5/WG 10
Secretariat: BSI
Date: 2026-05-11xx
Sampling-based conformity assessment
All rights reserved. Unless otherwise specified, or required in the context of its implementation, no part of this
publication may be reproduced or utilized otherwise in any form or by any means, electronic or mechanical, including
photocopying, or posting on the internet or an intranet, without prior written permission. Permission can be requested
from either ISO at the address below or ISO’s member body in the country of the requester.
ISO copyright office
CP 401 • Ch. de Blandonnet 8
CH-1214 Vernier, Geneva
Phone: +41 22 749 01 11
Email: copyright@iso.org
Website: www.iso.org
Published in Switzerland
ii
Contents
Foreword . v
Introduction . vi
Motivation . vi
Conformity assessment and acceptance sampling . vi
1 Scope . 1
2 Normative references . 2
3 Terms and definitions . 2
4 Background information regarding the ISO plans . 7
4.1 Attributes plans constructed in terms of unity value . 7
4.2 Variables plans constructed in terms of the producer’s risk . 10
5 Prior and posterior distributions . 11
6 Framework for risk assessment . 14
6.1 Classical versus information-based risks . 14
6.2 Overview of information-based risks . 16
6.3 Definition of global and conditional risks on the basis of contingency tables . 20
6.3.1 Global risks . 20
6.3.2 Risks conditional on 𝐘𝐘 (acceptance or rejection) . 21
6.3.3 Risks conditional on 𝐗𝐗 (conformance or nonconformance) . 21
6.4 Information-based versus classical calculation of the information-based risks . 22
6.4.1 Process versus lot . 22
6.4.2 Comparison of information-based and classical calculations of the information-based
risks . 23
6.4.3 Two different calculations of the specific risks . 25
7 Selection of an appropriate approach for the design of an acceptance sampling plan . 27
7.1 Risk versus utility . 27
7.2 Approach for deriving a prior distribution: Expert Knowledge Elicitation (EKE) versus
data-driven . 27
7.2.1 Expert knowledge elicitation . 27
7.2.2 GLMM approach . 32
7.3 Variation of quality over time. 33
7.4 Overview . 33
8 Bayesian plans: risk-based approach . 36
8.1 Description of the approach . 36
8.2 Taking the producer’s risk into account . 38
9 Bayesian plans: utility-based approach . 42
9.1 Utility based on the consumer’s perspective . 43
9.1.1 Definition . 43
9.1.2 The consumer . 43
9.1.3 Mathematical expression . 44
9.1.4 Example . 45
9.1.5 Notation and preliminary considerations . 48
9.1.6 Estimation of the utility under the prior distribution . 49
9.1.7 Utility curves . 50
iii
9.1.8 Calculation of the sample size 𝐧𝐧 and the acceptance number 𝐜𝐜 . 52
9.1.9 Evidence-based approach . 54
9.1.10 Standard plans . 55
9.1.11 Broader view of utility . 60
9.2 Adversarial approach . 61
9.2.1 Description of the approach . 61
9.2.2 Calculations . 62
9.2.3 Example 1 . 64
9.2.4 Example 2 . 66
10 Inspection of a series of lots with data ageing . 68
10.1 Bayesian updating mechanism . 68
10.2 Procedure . 69
10.3 Example 1: comparison of three scenarios with constant sample size and acceptance
number specified in advance . 72
10.4 Example 2: revisiting the two scenarios from 10.1 . 74
Bibliography . 76
iv
Foreword
ISO (the International Organization for Standardization) is a worldwide federation of national standards
bodies (ISO member bodies). The work of preparing International Standards is normally carried out through
ISO technical committees. Each member body interested in a subject for which a technical committee has been
established has the right to be represented on that committee. International organizations, governmental and
non-governmental, in liaison with ISO, also take part in the work. ISO collaborates closely with the
International Electrotechnical Commission (IEC) on all matters of electrotechnical standardization.
The procedures used to develop this document and those intended for its further maintenance are described
in the ISO/IEC Directives, Part 1. In particular, the different approval criteria needed for the different types of
ISO documents should be noted. This document was drafted in accordance with the editorial rules of the
ISO/IEC Directives, Part 2 (see www.iso.org/directives).
ISO draws attention to the possibility that the implementation of this document may involve the use of (a)
patent(s). ISO takes no position concerning the evidence, validity or applicability of any claimed patent rights
in respect thereof. As of the date of publication of this document, ISO had not received notice of (a) patent(s)
which may be required to implement this document. However, implementers are cautioned that this may not
represent the latest information, which may be obtained from the patent database available at
www.iso.org/patents. ISO shall not be held responsible for identifying any or all such patent rights.
Any trade name used in this document is information given for the convenience of users and does not
constitute an endorsement.
For an explanation of the voluntary nature of standards, the meaning of ISO specific terms and expressions
related to conformity assessment, as well as information about ISO's adherence to the World Trade
Organization (WTO) principles in the Technical Barriers to Trade (TBT), see www.iso.org/iso/foreword.html.
This document was prepared by Technical Committee ISO/TC 69, Applications of statistical methods,
Subcommittee SC 5, Acceptance Samplingsampling.
Any feedback or questions on this document should be directed to the user’s national standards body. A
complete listing of these bodies can be found at www.iso.org/members.html.
v
Introduction
0.1 Motivation
The question whether the contents of a given lot (shipment, container, batch) or the production units of a
process meet specified quality criteria plays a central role in many areas. For instance, in industry, lot or
process inspection is a quality control measure for monitoring a manufacturing process; in international trade,
lot inspection is performed to decide whether to accept an individual lot; and a governmental food safety
agency inspects lots to ensure contaminant levels are below legal limits. Inspecting the entire lot is seldom a
viable option. Instead, a random sample is taken from the lot and an acceptance rule is applied to the test
results (whether qualitative or quantitative) obtained from the sample. The activity of inspecting lots in this
manner is referred to as acceptance sampling. An acceptance sampling plan thus consists of instructions for
taking a sample (in particular, a requirement regarding sample size) and an acceptance rule.
Acceptance sampling plans are described in the ISO 2859 series (inspection by attributes) and the ISO 3951
series (inspection by variables). The plans in these ISO standards are indexed by lot size and a given lot quality
level expressed e.g. in terms of the proportion of nonconforming items in the lot. This characterization of lot
quality is intended to represent either a quality level at which a high probability of acceptance is desirable, in
which case it is called the acceptance quality limit (AQL) or the producer’s risk quality level (PRQ); or a quality
level at which a low probability of acceptance is desirable, in which case it is called the limiting quality (LQ)
or the consumer’s risk quality level (CRQ). The plans in these ISO standards are assessed via the operating
characteristic curve (OC curve), which plots the probability of acceptance against the quality level and via the
producer’s risk PR (the probability of rejection at PRQ) and the consumer’s risk CR (the probability of
acceptance at CRQ).
The main question the present TRthis document addresses is the following: is it possible to propose a
framework for the design of acceptance sampling plans which mobilizes prior information in order to achieve
a reduction in sample size?
JCGM 106 [1] discusses how to take measurement uncertainty into consideration in conformity assessment,
i.e. in determining whether an individual test item fulfils specified requirements. In doing so, JCGM 106
proposes a Bayesian framework along with new definitions of the producer’s and consumer’s risks which will,
in the following, be collectively referred to as “information-based” risks. Many of the concepts from JCGM 106
will be adapted and applied in the present TRthis document.
Even though the focus in this TRdocument is on the inspection of isolated lots, there is often an underlying
production process. This raises the question of the extent to which it is sensible to incorporate information
regarding the quality of the process or the quality of previous lots in the design of the acceptance sampling
plan for the lot currently under inspection. This aspect will play a central role in the present TR. Sectionthis
document. Clause 10 addresses the inspection of a series of lots.
Finally, it must be emphasized that, in connection with the lot inspection applications considered in the
present technical report, it is not admissible to establish prior distributions on the basis of purely subjective
belief. Here prior distributions have to be based on evidence obtained via sound scientific methods. The form
such evidence takes can be e.g. empirical data from past inspections, quality control data or certificates from
the producer/manufacturer or a report or conclusions obtained via a formal expert knowledge elicitation
procedure (see Section 7.2.1). For a more extensive discussion of these and related questions, the reader is
referred to Bernardo (2005) [17] and Göb (2015) [19].
0.2 Conformity assessment and acceptance sampling
In sampling-based conformity assessment, there are three levels of conformity: the conformity of the process,
of the lot and of individual items. The central question is whether the lot or process is conforming, and the
main difference between the approach described here and the ISO approach is that a conformity region for lot
vi
or process quality must be defined prior to acceptance sampling. If the focus is lot inspection, the conformity
of the process is not directly taken into account; rather, it plays a role in the background insofar as it underlies
the quality of the lot. Finally, the quality of individual items plays a role insofar as the quality of the lot or
process is expressed in terms of the proportion of nonconforming items and insofar as the criterion for process
or lot acceptance is expressed in terms of the number of nonconforming items in the sample. The criterion for
the conformity of an individual item can be expressed e.g. in terms of specification limits .
Comparing JCGM 106 with the ISO standards on acceptance sampling, it would seem reasonable to draw the
following distinction between conformity assessment (CA) and acceptance sampling (AS):
— in CA as per JCGM 106, testing is performed based on the basis of one single item; the aim is to assess
the conformity of the true value of the property of interest (i.e.,. the measurand, in the strict
metrological sense). There is no attempt to evaluate the quality of a lot from a sample of items drawn
from that lot.
— in AS as per ISO standards, testing is performed based on the basis of a sample of several discrete items
taken from the lot. In inspection by variables, it is not the conformity of each item which is determined;
rather, one test result is obtained for each item in the sample, and the proportion nonconforming in
the lot is estimated on the basis of the distribution of these test results.
A related difference between the two is as follows:
— In CA, measurement uncertainty is taken into account in the decision rule . Thus, in CA, the focus is on
the measurand.
— In AS for inspection by variables as per ISO standards, the rule for lot acceptance or rejection takes
into account the lot standard deviation, which describes how the property of interest varies in the lot,
rather than variation between test results, which could reflect other effects such as analytical
uncertainty, effects due to the sampling procedure (sampling uncertainty), etc. Thus, in AS, the
acceptance rule is expressed in terms of the statistical properties of the lot and—, if possible—,
measurement uncertainty is ignored.
The following points highlight conceptual similarities between conformity assessment and acceptance
sampling:
— AS can be “re-interpreted” in such a way that the entire framework is formulated in terms of a
“measurand,” thus establishing a common conceptual framework with conformity assessment. In this
re-interpretation, the measurand consists of the relevant parameters (e.g. proportion nonconforming,
lot mean, lot standard deviation) for the lot.
— In the classical CA framework, conformity often requires the measurement uncertainty to be
sufficiently low, e.g. in the case of a decision rule such as test result + uncertainty ≤ upper specification
limit. Similarly, in AS, one could formulate requirements regarding sufficiently low specific producer’s
or consumer’s risks.
In ISO standards, the term specification limit is reserved for criteria regarding individual items.
The definition of a “decision rule” (for use in conformity assessment) in ISO 17025 [3] is as follows: Rule that describes
how measurement uncertainty is accounted for when stating conformity with a specified requirement.
vii
— For both CA and AS, one can define “information-based” risks which can be regarded as
complementary to the “classical” risks as defined in the ISO standards (see below, Section 6.1).
Finally, if acceptance sampling takes the form of applying a criterion for the lot mean and if only one test result
is obtained from a unique composite sample obtained from the lot, then there might not be any meaningful
distinction between conformity assessment and acceptance sampling. Hence, in clarifying the relationship
between conformity assessment and acceptance sampling, the distinction between plans for the proportion
nonconforming and plans for the lot mean needs to be borne in mind. This can simply be equivalent to
distinguishing plans where the criterion is formulated in terms of a measurand in the strict metrological sense
and plans where the criterion relates to the proportion nonconforming.
viii
FINAL DRAFT Technical Report ISO/DTR 24962:2026(en)
Sampling-based conformity assessment
1 Scope
This TRdocument provides an overview of the use of prior information in acceptance sampling. The methods
described in the present TRthis document can be applied for the inspection of both processes and lots.
Not only do manufacturing or production processes lie within the scope of the present TRthis document; but
the scope also covers any process whose outcome are discrete physical or digital units whose conformity can
be assessed. In particular, the method described in the present TRthis document can also be applied to AI-
based classification systems. The production unit would then consist of the pair (object to be assigned to a
class, assigned class) and a conforming unit would be defined as a correct classification.
As far as lots are concerned, the scope of the present TRthis document includes both the inspection of isolated
lots and serial lot inspection. The term “isolated lot inspection” does not mean that the consumer has no access
to information regarding lot quality prior to the inspection of the current lot. Rather “isolated lot inspection”
means that there are no switching rules and that the acceptance sampling plan is calculated separately for
each new lot. In particular, the consumer having past experience with or knowledge regarding the producer of
the lot currently under inspection is perfectly compatible with the concept of “isolated lot inspection.”
This TRdocument consists of three main parts.
First, a risk-based approach is described (Sectionsee Clause 8). This approach is based on concepts (such as
specific consumer’s risk and conformance probability) defined in JCGM 106. It is shown how the sample size
and the acceptance number can be calculated once a region for lot conformance and a tolerance for the specific
consumer risk have been specified. In addition, an overview of information-based risks is provided.
Second, a utility-based approach is described (Sectionsee Clause 9). This approach replaces the underlying
principle of risk aversion with a rational cost-benefit calculus. Indeed, risk-based approaches consider neither
the testing &and sampling costs, nor hidden costs such as administrative overhead, nor the potential benefits
associated with lot acceptance. By contrast, in the utility-based approach, all potential benefits, costs, losses
and damages—including testing &and sampling costs, potential costs associated with recalling a lot or
healthcare, reputational costs, costs caused by the ingestion of contaminated food, and the bureaucratic and
administrative costs associated with the implementation of regulations—are internalized in one utility
function. In this sense, the utility approach bridges the gap between the “old world” of risks and the “new
world” of utility. Tables with standard plans for various cost-structures and lot size values are provided.
Third, an approach for serial lot inspection is described (Sectionsee Clause 9). In this approach, a Bayesian
updating framework is provided in which data-ageing is reflected in a downweightingdown weighting
mechanism for older data.
Prior to these three parts, there are five preliminary sectionsclauses:
— Introduction;
— Terms and definitions (SectionClause 3));
— Background information regarding the plans in the ISO 2859 and ISO 3951 standards (SectionClause
4));
— Background regarding prior and posterior distributions (SectionClause 5));
— Overall framework in which the classical and information-based risks can be seen as complementary
(SectionClause 6));
— Guidance for deriving a prior distribution and selecting an appropriate approach for the design of an
acceptance sampling plan (SectionClause 7)).
Throughout this TRdocument, the aim is to propose relatively straightforward and pragmatic methods for the
design of acceptance sampling plans. Nonetheless, in parallel to the approach, the background theory is
provided and illustrated with examples.
The present TRThis document focuses on lots consisting of discrete items and lot inspection by attributes. The
methods presented here can be extended for lots consisting of bulk material and for inspection by variables.
This will be the subject of subsequent work.
Measurement and inspection error are not considered in this TRdocument. The methods described here can
be adjusted to take various error sources into account. This will be the subject of subsequent work.
Finally, in this TRdocument, the testing outcome is usually considered to follow a binomial distribution.
Strictly speaking, this is more appropriate for the underlying process than for the lot. The methods described
in this TRdocument can be adjusted in such a way that the testing outcome is modelled via the hypergeometric
distribution, see Section 6.4.2.
2 Normative references
There are no normative references in this document.
3 Terms and definitions
For the purposes of this document, the following terms and definitions apply.
ISO and IEC maintain terminology databases for use in standardization at the following addresses:
— ISO Online browsing platform: available at https://www.iso.org/obp
— IEC Electropedia: available at https://www.electropedia.org/
In the following, many terms are defined in relation to the lot. Where appropriate, the term lot can simply be
replaced by the term process. Much of the terminology and notation used in this technical report (TR) is taken
from or closely reflects JCGM 106 [1]. In JCGM 106 the realizations of random variables are denoted via Greek
letters (e.g. eta 𝜂𝜂). In such cases, for the sake of simplicity, the notation has been changed.
3.1
acceptance number
𝑐𝑐
Specifiedspecified maximum value for 𝑦𝑦 (number of items determined to be nonconforming during
inspection) used in the acceptance region [0, 𝑐𝑐].]
3.2
acceptance region
𝒜𝒜
Note 1 to entry: 𝒜𝒜 denotes the acceptance region, expressed as the closed interval [0, 𝑐𝑐],] where 𝑐𝑐 lies in [0, 𝑛𝑛]
and denotes the acceptance number (3.1),) a specified maximum value for 𝑦𝑦 (the number of items determined
to be nonconforming during inspection).)
Note 1 to entry: For instance, if 𝑐𝑐 is specified as 0 and 𝑦𝑦 > 0 is obtained during the lot inspection, the lot will be
rejected—no matter whether or not it actually complies with the criterion regarding lot quality.
Note 2 to entry: A closed interval [a,b] includes both a and b.
3.3
acceptance sampling plan
(𝑛𝑛, 𝑐𝑐)
For acceptance sampling plan consistsconsisting of a sample size and
acceptance number (3.1)
3.4
beta function
( )
𝐵𝐵𝛼𝛼,𝛽𝛽
𝛼𝛼−1 𝛽𝛽−1
𝐵𝐵(𝛼𝛼,𝛽𝛽) =�𝑢𝑢 ∙ (1−𝑢𝑢) 𝑑𝑑𝑢𝑢d𝑢𝑢
3.5
conditional consumer’s risk (conditional on 𝑿𝑿)
CCRₓ
How likely is itprobability that a lot is accepted, given that it is nonconforming?
3.6
conditional consumer’s risk (conditional on 𝒀𝒀)
CCR
y
How likely is itprobability that a lot is nonconforming, given that it is accepted?
3.7
conditional producer’s risk (conditional on 𝑿𝑿)
CPRₓ
How likely is itprobability that a lot is rejected, given that it is conforming?
3.8
conditional producer’s risk (conditional on 𝒀𝒀)
CPR
y
How likely is itprobability that a lot is conforming, given that it is rejected?
3.9
conformance probability
𝑝𝑝 (𝑦𝑦)
𝑐𝑐𝑐𝑐𝑛𝑛𝑐𝑐
probability of conformance given the testing outcome 𝑦𝑦
Note 1 to entry: The probability of conformance is evaluated for a given testing outcome y. For this reason, in a Bayesian
context, it is evaluated via the posterior distribution.
Note 2 to entry: This quantity plays a central role in the approach described in SectionClause 8.
3.10
consumer
The trading party which purchases the lot from the producer
3.11
consumer’s risk
CR
The probability that a nonconforming lot or that a lot with unacceptable quality CRQ (3.12) is accepted
3.12
consumer’s risk quality level
CRQ
Lotlot quality level which is considered unacceptable and thus results in a low probability of acceptance (e.g.
10%)
Note 1 to entry: the CRQ is also called LQ (e.g. in the ISO 2850 and ISO 3951 standards)).
3.13
global consumer’s risk
GCR
How likely is itprobability that a lot is both nonconforming and accepted?
3.14
global probability of acceptance
GP
acc
How likely is itprobability that a lot is accepted – no matter whether it is conforming or not?
3.15
global probability of rejection
GPᵣₑⱼ
How likely is itprobability that a lot is rejected – no matter whether it is conforming or not?
3.16
global producer’s risk
GPR
How likely is itprobability that a lot is both conforming and rejected?
3.17
inspection by attributes
Lotlot inspection where the test result for a given item is qualitative: conforming versus nonconforming
3.18
inspection by variables
Lotlot inspection where the test result for a given item or laboratory sample is quantitative (continuous scale)
3.19
lot or process conformity region
𝒞𝒞
𝒞𝒞 denotes the conformance region for the “true” proportion nonconforming 𝑋𝑋 (3.20, 3.28),, expressed as the
closed interval [0, 𝑥𝑥 ], where 𝑥𝑥 lies in [0,1] and denotes a specified maximum value for 𝑋𝑋.
𝒞𝒞 𝒞𝒞
Note 1 to enry: For instance, if 𝑥𝑥 is specified as 10 %, this means that a lot whose true proportion
𝒞𝒞
nonconforming is greater than 10 % does not comply with the criterion regarding lot quality—no matter
whether it has been accepted or rejected.
3.20
lot proportion nonconforming
𝑥𝑥
𝐿𝐿
proportion of nonconforming items in the lot
Note 1 to entry: If the proportion nonconforming is modelled as a random variable, then 𝑥𝑥𝑃𝑃 and 𝑥𝑥𝐿𝐿 are realizations of 𝑋𝑋𝑃𝑃
and 𝑋𝑋𝐿𝐿, respectively.
3.21
lot size
𝑁𝑁
Numbernumber of items in the lot
3.22
number of nonconforming items in the lot
𝑀𝑀
Note 1 to entry: 𝑀𝑀𝑀𝑀𝑀𝑀𝑛𝑛 denotes the minimum number of nonconforming items in a lot of 𝑁𝑁 items (often, we have 𝑀𝑀𝑀𝑀𝑀𝑀𝑛𝑛 =
0, however, there are circumstances where 𝑀𝑀 = 0 is not possible)).
Note 2 to entry: 𝑀𝑀𝒞𝒞 denotes the number of nonconforming items in a lot of 𝑁𝑁 items corresponding to upper limit of the
lot conformity region 𝑥𝑥𝒞𝒞, i.e. 𝑀𝑀𝒞𝒞 = floor(𝑥𝑥𝒞𝒞 ∙ 𝑁𝑁)).
Note 3 to entry: 𝑀𝑀𝑀𝑀𝑀𝑀𝑥𝑥 denotes the maximum number of nonconforming items in a lot of 𝑁𝑁 items (often, we have 𝑀𝑀𝑀𝑀𝑀𝑀𝑥𝑥
= 𝑁𝑁, however, there are circumstances where 𝑀𝑀 = 𝑁𝑁 is not possible)).
Note 4 to entry: 𝑀𝑀𝒞𝒞,𝑦𝑦 = 𝑥𝑥𝒞𝒞 ∙ 𝑁𝑁 − 𝑦𝑦 denotes the maximum number of nonconforming items in a conforming lot, taking into
account the 𝑦𝑦 nonconforming items in the sample.
3.23
posterior distribution for the lot proportion nonconforming posterior distribution
𝑔𝑔(𝑥𝑥|𝑦𝑦); 𝑔𝑔 (𝑥𝑥|𝑦𝑦)
𝑝𝑝𝑝𝑝𝑝𝑝𝑝𝑝
Posteriorposterior distribution for the lot proportion nonconforming (3.20).)
Note 1 to entry: The consumer and producer can have different posteriors, denoted 𝑔𝑔 (𝑥𝑥|𝑦𝑦) and 𝑔𝑔 (𝑥𝑥|𝑦𝑦),
𝑐𝑐𝑝𝑝𝑐𝑐𝑝𝑝 𝑝𝑝𝑝𝑝𝑝𝑝𝑝𝑝
respectively.
3.24
prior distribution for the lot proportion nonconforming prior distribution
𝑔𝑔 (𝑥𝑥); 𝑔𝑔 (𝑥𝑥;ϑ)
0 𝑝𝑝𝑝𝑝𝑝𝑝𝑝𝑝𝑝𝑝
Priorprior distribution for the lot proportion nonconforming (3.20).
Note 1 to entry: The consumer and producer can have different priors, denoted 𝑔𝑔 (𝑥𝑥|𝑦𝑦) and 𝑔𝑔 (𝑥𝑥|𝑦𝑦), respectively.
𝑐𝑐𝑝𝑝𝑐𝑐𝑝𝑝 𝑝𝑝𝑝𝑝𝑝𝑝𝑝𝑝
3.25
probability density function of the beta distribution
( )
𝑐𝑐 𝑥𝑥;𝛼𝛼,𝛽𝛽
𝐵𝐵𝐵𝐵𝑝𝑝𝐵𝐵
𝛼𝛼−1 𝛽𝛽−1
( )
𝑥𝑥 ∙ 1−𝑥𝑥
( )
𝑐𝑐 𝑥𝑥;𝛼𝛼,𝛽𝛽 =
𝐵𝐵𝐵𝐵𝑝𝑝𝐵𝐵
𝐵𝐵(𝛼𝛼,𝛽𝛽)
3.26
probability mass function of binomial distribution
( )
𝑐𝑐 𝑦𝑦;𝑛𝑛,𝑥𝑥
𝐵𝐵𝑝𝑝𝑐𝑐𝑝𝑝𝐵𝐵
𝑛𝑛
𝑦𝑦 𝑐𝑐−𝑦𝑦
( ) ( )
𝑐𝑐 𝑦𝑦;𝑛𝑛,𝑥𝑥 =� �∙𝑥𝑥 ∙ 1−𝑥𝑥
𝐵𝐵𝑝𝑝𝑐𝑐𝑝𝑝𝐵𝐵
𝑦𝑦
3.27
probability mass function of hypergeometric distribution
𝑐𝑐 (𝑦𝑦;𝑛𝑛,𝑀𝑀,𝑁𝑁)
𝐻𝐻𝑦𝑦𝑝𝑝𝐵𝐵𝑝𝑝
𝑀𝑀 𝑁𝑁−𝑀𝑀
� �∙� �
𝑦𝑦 𝑐𝑐−𝑦𝑦
( )
𝑐𝑐 𝑦𝑦;𝑛𝑛,𝑀𝑀,𝑁𝑁 =
𝐻𝐻𝑦𝑦𝑝𝑝𝐵𝐵𝑝𝑝
𝑁𝑁
� �
𝑐𝑐
3.28
process proportion nonconforming
𝑥𝑥
𝑃𝑃
proportion of nonconforming items for the process
Note 1 to entry: If the proportion nonconforming is modelled as a random variable, then 𝑥𝑥 and 𝑥𝑥 are realizations of 𝑋𝑋
𝑃𝑃 𝐿𝐿 𝑃𝑃
and 𝑋𝑋 , respectively
𝐿𝐿
3.29
producer
The trading party which sells the lot to the consumer
Note 1 to entry: the producer can be a manufacturer, supplier, state, etc.
3.30
producer’s risk
PR
The probability that a conforming lot or that a lot with acceptable quality PRQ (3.31) is rejected
3.31
producer’s risk quality level
PRQ
Lotlot quality level which is considered acceptable and thus results in a high probability of acceptance (e.g.
95%)
Note 1 to entry: the PRQ is also called AQL (e.g. in the ISO 2859 and ISO 3951 standards)).
3.32
proportion nonconforming
𝑋𝑋
Proportionproportion of nonconforming items in the lot (or process)
Note 1 to entry: In Bayesian approaches to acceptance sampling, 𝑋𝑋 is a random variable with realizations 𝑥𝑥.
Note 2 to entry: In the ISO 2859 and ISO 3951 standards, the proportion nonconforming is treated as the parameter of a
statistical distribution for the probability of acceptance, i.e. as a constant.
3.33
sample size
𝑛𝑛
Numbernumber of items in the sample taken from the lot
3.34
specific CR
SCR(𝑦𝑦)
How likely is itprobability that a lot is nonconforming, given that it is accepted?
Note 1 to entry: Evaluated for a specific testing outcome 𝑦𝑦 resulting in acceptance.
Note 2 to entry: This risk plays a central role in the approach described in SectionClause 8.
3.35
specific PR
SPR(𝑦𝑦)
How likely is itprobability that a lot is conforming, given that it is rejected?
Note 1 to entry: Evaluated for a specific testing outcome 𝑦𝑦 resulting in rejection.
3.36
testing outcome
𝑌𝑌
Numbernumber of nonconforming items in the sample (determined after testing each item in the sample)
Note 1 to entry: 𝑌𝑌 is a random variable with realizations 𝑦𝑦
Note 2 to entry: Note that 𝑦𝑦/𝑛𝑛 can be considered a more appropriate testing outcome so that the “measurand” and the
“measurement” represent the same type of quantity (e.g. a proportion). Mathematically, however, the use of 𝑦𝑦 is more
convenient (via the binomial distribution).
3.37
upper limit of lot or process or lot conformity region upper limit
𝑥𝑥
𝒞𝒞
Upperupper limit of the lot or process or lot conformity region (3.19).)
4 Background information regarding the ISO plans
The ISO standards apply a risk-based approach to the design of acceptance sampling plans, combined with a
focus on convenient or simplified calculations. In inspection by attributes, it is the product PRQ × sample size
(or, equivalently, the ratio between CRQ and PRQ) which informs the design of the plans. In inspection by
variables, the plans indexed by AQL (PRQ) aim to achieve a PR which depends on the lot size.
4.1 Attributes plans constructed in terms of unity value
In the ISO 2859-1 standard [8], the plans are constructed in such a manner as to have constant acceptance
number values across the diagonals of the sampling plan tables. This sectionsubclause provides a short
rationale for this approach.
ISO 2859-1, the AQL (PRQ) values and the sample size values are “approximate” geometric series. The
following table shows a selection of sample size values along with the ratio between consecutive values.
Table 1 — Sample size values from ISO 2859-1 as a geometric series
Sample Ratio between consecutive
size sample sizes
8 1.60
13 1.63
20 1.54
32 1.60
50 1.56
As can be seen, the ratio between two consecutive sample size values is always close to 1.6. The ratio between
consecutive AQL (PRQ) values is also approximately 1.6, as shown in the following table.
Table 2 — AQL (PRQ) values from ISO 2859-1 as a geometric series
Ratio between consecutive
AQL
AQL values
0.010
0.015 1.50
0.025 1.67
0.040 1.60
0.065 1.63
0.100 1.54
As a result, the product PRQ × sample size remains “near constant” across the diagonals of the sampling plan
tables. This is illustrated in the following table, for a selection of AQL values.
Table 3 — The product PRQ × sample size remains “near constant” across the diagonals of the sampling plan tables
AQL (PRQ)
Sample
0.001 0.0015 0.0025 0.004 0.0065 0.01 0.015 0.025 0.04 0.065 0.1
size
2 0.002 0.003 0.005 0.008 0.013 0.02 0.03 0.05 0.08 0.13 0.2
3 0.003 0.005 0.008 0.012 0.020 0.03 0.05 0.08 0.12 0.20 0.3
5 0.005 0.008 0.013 0.020 0.033 0.05 0.08 0.13 0.20 0.33 0.5
8 0.008 0.012 0.020 0.032 0.052 0.08 0.12 0.20 0.32 0.52 0.8
13 0.013 0.020 0.033 0.052 0.085 0.13 0.20 0.33 0.52 0.85 1.3
20 0.020 0.030 0.050 0.080 0.130 0.20 0.30 0.50 0.80 1.30 2.0
32 0.032 0.048 0.080 0.128 0.208 0.32 0.48 0.80 1.28 2.08 3.2
50 0.050 0.075 0.125 0.200 0.325 0.50 0.75 1.25 2.00 3.25 5.0
80 0.080 0.120 0.200 0.320 0.520 0.80 1.20 2.00 3.20 5.20 8.0
125 0.125 0.188 0.313 0.500 0.813 1.25 1.88 3.13 5.00 8.13 12.5
200 0.200 0.300 0.500 0.800 1.300 2.00 3.00 5.00 8.00 13.00 20.0
315 0.315 0.473 0.788 1.260 2.048 3.15 4.73 7.88 12.60 20.48 31.5
500 0.500 0.750 1.250 2.000 3.250 5.00 7.50 12.50 20.00 32.50 50.0
800 0.800 1.200 2.000 3.200 5.200 8.00 12.00 20.00 32.00 52.00 80.0
1250 1.250 1.875 3.125 5.000 8.125 12.50 18.75 31.25 50.00 81.25 125.0
2000 2.000 3.000 5.000 8.000 13.000 20.00 30.00 50.00 80.00 130.00 200.0
The product PRQ × sample size is called the unity value and can be understood as the number of expected
nonconforming items in the sample for lot quality AQL. For example, for lot quality 1% proportion
nonconforming and a sample size of 20 items, we can expect 0.2 nonconforming items. This is the rationale
for having constant acceptance number values across diagonals in ISO 2859-1.
4.2 Variables plans constructed in terms of the producer’s risk
The “philosophy” of ISO acceptance sampling plans for inspection by variables is as follows.:
First, the ISO plans are designed in such a manner as to ensure either a high probability of acceptance at the
acceptance quality limit (AQL) i.e. at the producer’s risk quality level (PRQ) or a low probability of acceptance
at the limiting quality (LQ) i.e. at the consumer’s risk quality level (CRQ).
Secondly, the ISO plans indexed by AQL are constructed in such a way that the producer’s risk decreases as
the lot size increases. The following table, taken from the Mathematical and Statistical Principles underlying
Military Standard 414 [2], shows the producer’s risk in terms of the sample size code letter (reflecting lot size):
Table 4 — Lot size in the ISO standards
Sample size code Producer’s risk
letter
B 0.,11
C 0.,10
D 0.,10
E 0.,10
F 0.,10
G 0.,09
H 0.,08
I 0.,07
J 0.,06
K 0.,06
L 0.,05
M 0.,05
N 0.,04
O 0.,03
P 0.,02
Q 0.,01
As can be seen the “target” PR of 5 % is only achieved from code letter L onwards. Indeed, the PR is better than
5 % from code letter N onwards, achieving 1 % for code letter Q.
In the plans in ISO 3951-2, the producer’s risk remains “near constant” along the diagonals (from bottom left
to top right).
Not all variables plans in the ISO 3951 series follow this principle. In particular, the plans in ISO 3951-1 and
ISO 3951-6 were constructed via “OC-curve-matching.” In ISO 3951-1, the plans (which are indexed by AQL,
i.e. PRQ) were constructed so as to obtain similar (near-identical in the case that the process standard
deviation is unknown) OC curves to those in ISO 2859-1, see 10.2 c) of ISO 3951-1. In ISO 3951-6, the plans
(which are indexed by LQ i.e. CRQ) were constructed so as to obtain similar OC curves to those in ISO 2859
-
2.
5 Prior and posterior distributions
The consumer’s or producer’s prior information regarding the “true” proportion nonconforming 𝑋𝑋 is
( ) ( )
encapsulated in the prior distribution 𝑔𝑔 𝑥𝑥 or 𝑔𝑔 𝑥𝑥 . For the sake of simplicity, in this TR,
0,𝑐𝑐𝑝𝑝𝑐𝑐𝑝𝑝 0,𝑝𝑝𝑝𝑝𝑝𝑝𝑝𝑝
wedocument focus on the beta family of distributions for the prior and posterior. The rationale is threefold:
first, calculations are simplified and consistent ; second, the beta distribution is widely used in the literature
(for example, the beta distribution is a paradigm for expert knowledge elicitation methodologies); and third,
it is highly flexible. There are, of course, many other possibilities, both discrete (e.g. one- or two-point priors)
and continuous. However, a discussion of all available options for the prior distribution would exceed the
scope of this TRdocument.
The beta family of distributions is generated via two hyperparameters α and 𝛽𝛽. For a given choice of 𝛼𝛼 and 𝛽𝛽,
the corresponding beta distribution is denoted Beta(𝛼𝛼,𝛽𝛽) and the probability density function is denoted
𝑐𝑐 (𝑥𝑥;𝛼𝛼,𝛽𝛽), for 𝑥𝑥 in the interval [0,1]. The following diagram shows different beta distributions. As can be
𝐵𝐵𝐵𝐵𝑝𝑝𝐵𝐵
seen, this family of distributions is quite versatile, allowing very different curves to be mapped via the choice
of α and 𝛽𝛽.
The beta distribution is conjugate with respect to the binomial likelihood. This means that the posterior follows the
same distribution as the prior, so in serial inspection, we havethere is consistent mathematics from one inspection to the
next.
Key
X = Proportion nonconforming 𝒙𝒙 alpha = 1, beta = 5
Y = Probability density function 𝒇𝒇 (𝒙𝒙;𝜶𝜶,𝜷𝜷) alpha = 5, beta = 1
𝑩𝑩𝑩𝑩𝑩𝑩𝑩𝑩
alpha = 2, beta = 5
Figure 1 — Different beta distributions
The case that the consumer has no prior information can be represented by the choice α =𝛽𝛽 = 0.5. In the case
of the beta family of distributions, this corresponds to the Jeffreys prior
Key
X = Proportion nonconforming 𝑥𝑥 Y = Probability density function 𝑐𝑐 (𝑥𝑥;𝛼𝛼,𝛽𝛽)
𝐵𝐵𝐵𝐵𝑝𝑝𝐵𝐵
Figure 2 — Beta distribution for 𝛂𝛂 =𝜷𝜷 =𝟎𝟎. ,𝟓𝟓
Another choice of noninformative prior is α =𝛽𝛽 = 1, yielding a uniform probability of occurrence for all
proportion nonconforming values.
Key
...